I have been following heart rate variability (HRV) on my watch and three different apps for the past several years. HRV is defined as the slight variations between R waves in the standard ECG recording. I have included an example below, illustrating the R-R’ intervals (or RRI) and how they might vary over time.
Since HRV became widely available as a measurement off a
watch that is commonly worn by millions of people, the research on this
measurement and the variable studied has increased significantly. For my purposes – HRV is thought to be an
indicator of heart health and conditioning and possibly a marker of
overtraining – but advice about that varies significantly. Some studies have
shown that decreased HRV is associated with an increased risk of arrhythmias. My recent cardiac ablation and cardioversion
seemed to present an ideal situation for further study.
Before getting into those details the physiology of HRV
needs to be considered. The dominant heart rhythm of a normal heart is
determined by the sinoatrial (SA) node. This node contains a population of
spontaneously depolarizing cells that determine the rhythm and rate of the
heartbeat. In addition to the neurophysiology of that cell population several
additional factors affect both the rate and HRV. Primary among them is autonomic innervation
from both the sympathetic and parasympathetic systems and their effect at the
SA node. Parasympathetic fibers from the vagus nerve modulate slower firing
through the neurotransmitter acetylcholine (ACh). Sympathetic fibers increase
the rate of firing through the neurotransmitter norepinephrine (NE). NE has a longer half-life than ACh, but vagal
tone is thought to be the most significant determinant of HRV. That is in line with several clinical
observations including lower baseline heart rates in conditioned athletes and
higher heart rates in people with less conditioning or in stressful situations.
What happened to my heart rate and HRV during the recent
cardiac ablation for atrial fibrillation and subsequent cardioversion? To answer that question, I had to figure out
how to get the data off my Apple Watch 5.0.
The only approach I could find was to downloaded all of the collected
Health App data as a CSV file and then plot it in Excel. There are some online sites that you can
download the data to and then use the remote software for plotting, but I
preferred to retain control over the data. If you decide to do that and have
several years of data like I did – it takes a long time. It took about 5 hours in my case to download
about 1G of data to a zip file. From
there it is easy to open that file with Excel or other software and do the
plots. A useful addition to the Health App would be able to download specific
time intervals.
I have done 2 plots so far based on average daily HRV and
hourly HRV as shown below.
I would expect to see an increase in vagal tone and
therefore HRV just related to the sustained high rates over 4 days. If
increased vagal tone correlates with increased HRV that does not seem to be the
case in these graphs. The graphs also seem to indicate to me that there may be
a structural element to HRV – either in the anatomical configuration of the
conducting cells, their altered physiology, or a combination.
The main implication for me at this point is to cautiously
restart my conditioning efforts and see what impact that has on the HRV
baseline. A second question is whether
my HRV will approach the pre-ablation baseline.
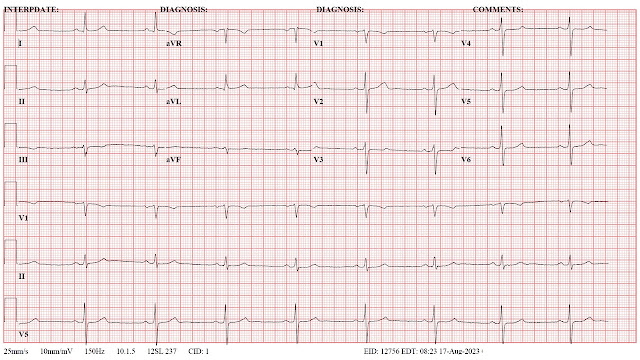
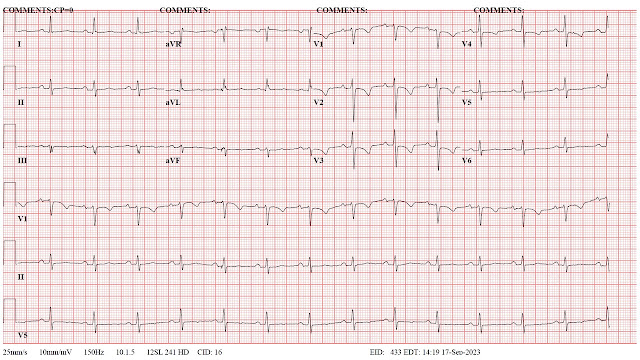
Electrocardiograms (ECG) may provide some clues in that direction. I have listed them below for references.
Significant changes occurred in the immediate post ablation ECG and the post
cardioversion ECG.
An additional thought is whether non linear analysis of the RR intervals would yield more information and easily interpretable graphics. I have used some of these attractor plots in the past and also applied them to single electrode analyses of normal controls and patients with Alzheimer's disease. In terms of ECG analysis - see figure 5 in reference 2. In terms of theory - these attractor diagrams also imply changes in biological complexity at either the structural or functional level - see the diagrams at the bottom of this post.
George Dawson, MD, DFAPA
ECG time course (1 -> 5 are in sequence):
1. Baseline - preop ECG
2. Post ablation ECG (following day):
4. Precardioversion ECG showing atrial flutter at a high rate (day 5 of this arrhythmia; post op day 14).
Heart Rate Variability
References:
1: Fojt O, Holcik J. Applying nonlinear dynamics to ECG signal
processing. Two approaches to describing ECG and HRV signals. IEEE Eng Med Biol
Mag. 1998 Mar-Apr;17(2):96-101. doi: 10.1109/51.664037. PMID: 9548087.
2: Nayak SK, Bit A, Dey A, Mohapatra B, Pal K. A Review on the
Nonlinear Dynamical System Analysis of Electrocardiogram Signal. J Healthc Eng.
2018 May 2;2018:6920420. doi: 10.1155/2018/6920420. PMID: 29854361; PMCID:
PMC5954865.
3: Aston PJ, Christie MI, Huang YH, Nandi M. Beyond HRV: attractor reconstruction using the entire cardiovascular waveform data for novel feature extraction. Physiol Meas. 2018 Mar 1;39(2):024001. doi: 10.1088/1361-6579/aaa93d. PMID: 29350622; PMCID: PMC5831644.


No comments:
Post a Comment